Current MOA catalogue data
Current MOA serviced-office catalogue snapshot
Data as of 14 August 2026
The fresh-price subset spans 49 operator-building groups and 14 operators. Central currently spans 18 buildings and 13 operators in the published catalogue.
This is a dated current snapshot. The mutable catalogue cannot establish a historical trend, vacancy rate, signed-deal result or guaranteed room availability.
Central's conventional Grade A office market is recovering, and several credible sources now show it. What that recovery does not tell you is whether any particular serviced-office price has moved, whether suitable rooms are scarce, or whether you have lost room to negotiate. Those are different questions about a different product.
If you are buying a serviced office, the useful response is not "sign before prices rise". It is to:
- decide whether Central is a hard requirement or one candidate among several;
- get your required start date and exact room into the search early;
- keep credible location alternatives alive;
- compare current, room-level proposals inside a short common window and on the same cost basis.
This report keeps the conventional Grade A signal and our own serviced-office catalogue apart, so neither gets asked to prove something it cannot.
The market signal in one sentence
Central led Hong Kong's conventional Grade A recovery in the first half of 2026 — with the strength varying by building tier, district, data provider and measurement method.
JLL reported Central Grade A rents up 7.3% across the first half, with Central vacancy falling to 8.8% at the end of June. Inside Central, the increase was concentrated in Grade A1 buildings rather than A2 or A3.
CBRE reported Central Grade A rents up 10.7% year to date, and 100 Central leasing deals in the first half — its highest first-half count since 2019. It also described the recovery as uneven across submarkets.
The Rating and Valuation Department's August 2026 supplement gives a third view, and a more complicated one. Its quality-adjusted Grade A rental index — which combines Sheung Wan and Central — read 233.3 in December 2025, then 226.5 in April, 221.5 in May, and a provisional 246.1 in June.
That last figure deserves a pause. The index falls for months, then jumps roughly 11% in a single provisional month. Provisional RVD readings are revised, and the index assigns rental evidence to the month a tenancy commences even though terms are typically agreed weeks earlier. A single month moving that far is a reason to look at the series rather than the headline — in either direction.
One market, three definitions
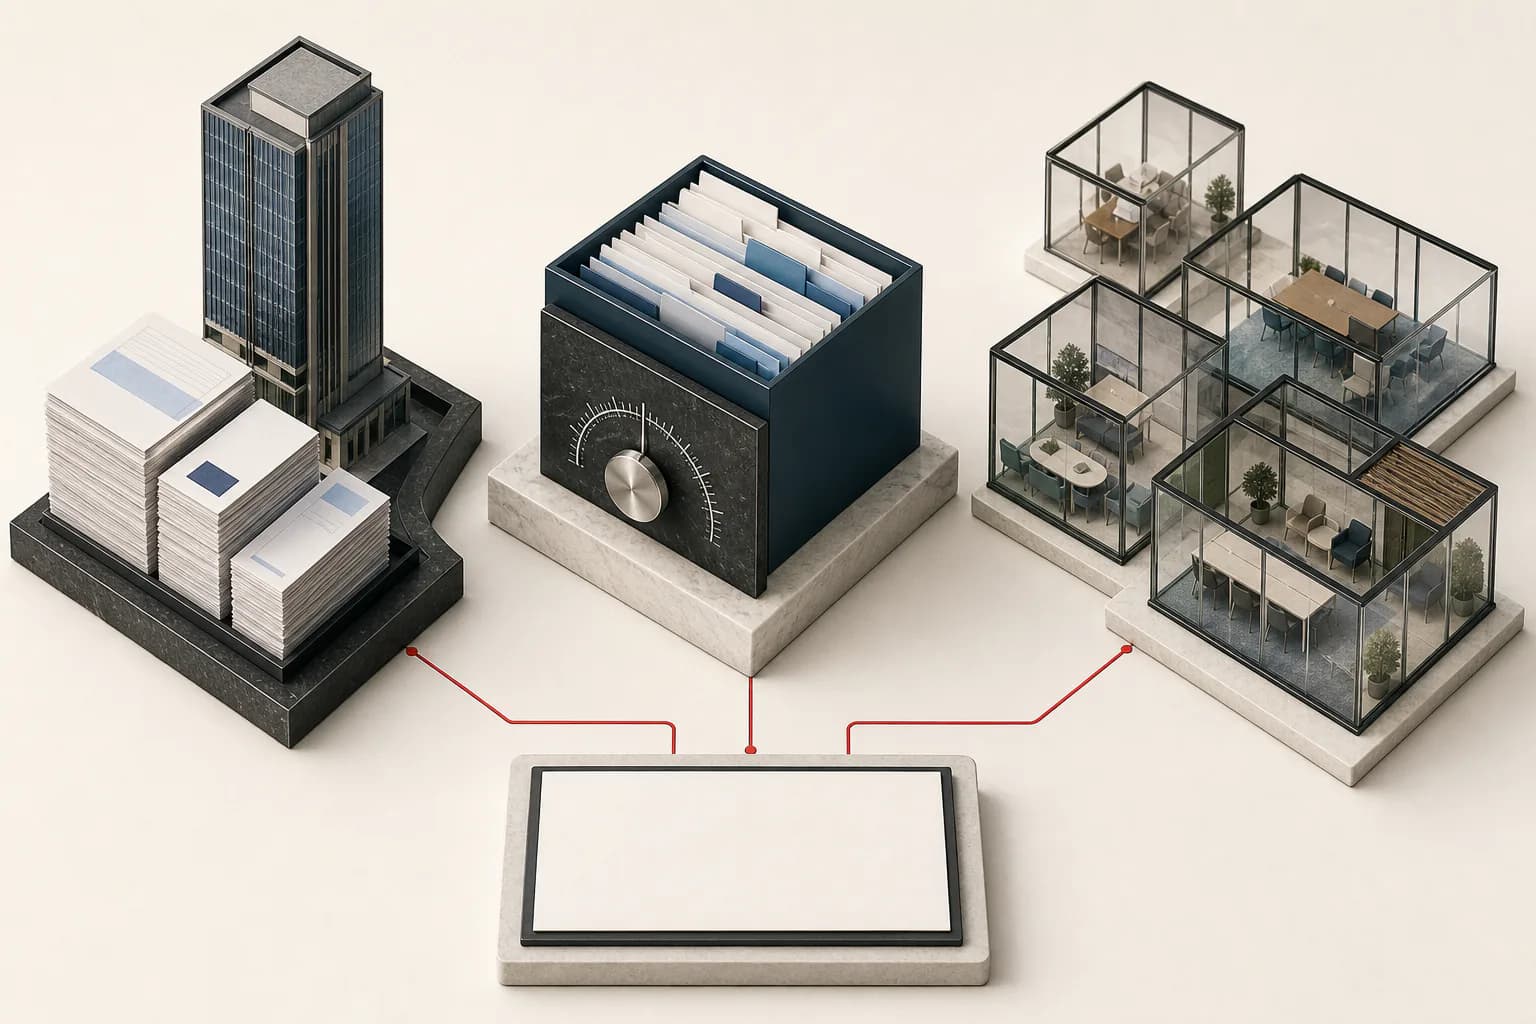
These numbers cannot be averaged. Each one carries its own product, geography, period and method.
| Source | Exact evidence | Reported signal | What it does not establish |
|---|---|---|---|
| JLL, published 6 July 2026 | Conventional Grade A offices; JLL's Central submarket; rent movement in 1H 2026 and vacancy at end-June | Central rents +7.3%; Central A1 +13.4%, A2 +5.6%, A3 +1.4%; vacancy 8.8% | Serviced-office price movement, availability of a particular room, or the terms one operator will quote |
| CBRE, published 7 July 2026 | Conventional Grade A offices; CBRE's submarkets; first-half and Q2 leasing indicators | Central rents +10.7% YTD; overall rents +3.5% YTD; Greater Tsim Sha Tsui +1.2% QOQ; decentralised submarkets still declining QOQ | A universal Hong Kong recovery, a serviced-office premium, or a forecast for an individual flexible centre |
| RVD, August 2026 supplement | Private Grade A office rental index, 1999=100; combined Sheung Wan/Central; tenancy commencement month | 233.3 Dec 2025; 226.5 Apr; 221.5 May; 246.1 provisional Jun | Central alone, serviced offices, asking prices, gross occupancy cost or any building-level quotation |
| Our live catalogue block | Current published serviced-office listings, with separate freshness and coverage rules | Current catalogue choice and a dated starting-price sample | Historical market movement, signed-deal prices or live room availability |
JLL also forecasts Central Grade A rents rising 10–15% across full-year 2026. A forecast is a scenario, not an achieved result and not a budgeting instruction. JLL's 0–5% forecasts for other core submarkets, and its expected declines in Hong Kong East and Kowloon East, are the reason "Hong Kong office rents are rising" is too blunt to plan with.
Why the numbers disagree
They are not measuring the same basket.
JLL and CBRE each maintain their own Grade A building universe, submarket boundaries and research method, which is why their Central figures should stay attributed to the firm that produced them. RVD, meanwhile, combines Sheung Wan and Central rather than publishing Central alone in this table.
RVD also works differently in three ways worth knowing. It assigns rental evidence to the month a tenancy commences, although its technical notes confirm terms are normally agreed earlier — around half a month to a month ahead for a fresh letting, one to three months for a renewal. It analyses rents net of rates, management and other charges, whereas a serviced-office proposal is judged as a package with its own inclusions and extras. And its index is built to hold quality constant, using the relationship between rent and rateable value rather than a simple average per square metre.
None of which makes one percentage the "real" one. What is defensible is this: several independent sources identify stronger momentum in Central, and the exact magnitude depends on how you define the market.
What this means if you are buying a serviced office
1. If Central is non-negotiable, treat it as a start-date problem
A Central address can be a genuine requirement — repeated client destinations, regulated or group-company needs, visitor expectations, or frequent routes through Central and Hong Kong stations. If it is, say so at the start of the search, along with:
- the target occupation date and any notice deadline you are working against;
- headcount, peak attendance and the layout you actually need;
- the minimum acceptable term and where you expect to outgrow it;
- total monthly budget, not just a per-desk target;
- any privacy, IT, access, air-conditioning or visitor-arrival condition that would rule a room out.
A recovering conventional market does not prove that suitable serviced rooms are scarce. It does make a vague, late search a worse idea when your location and date are already fixed. Availability still has to come from the operator, for a named room and a stated term.
Ask for a proposal that identifies the room or suite, the proposed start date, the billable capacity, how it fits your team in practice, the agreement term and the date the offer expires. A catalogue page reserves nothing.
2. Keep alternatives that solve the same journeys
The recovery is not citywide at equal strength. JLL's 1H 2026 figures show 1.7% for Wan Chai/Causeway Bay, 0.1% for Tsim Sha Tsui, −0.8% for Hong Kong East and −3.6% for Kowloon East. CBRE similarly expects rental and vacancy trends to stay uneven.
A weaker conventional submarket does not automatically produce a cheaper or better serviced office. What it does mean is that the location comparison should stay open rather than collapsing to a single assumption.
For a Central-led brief, test at least one credible alternative against the journeys that actually matter:
- Admiralty when the four-line interchange and the specific building access cut repeated travel;
- Wan Chai when Central and client destinations remain reachable from the right micro-location;
- Sheung Wan when the western side of the CBD works for the team and its visitors;
- Tsim Sha Tsui when Kowloon-side or cross-harbour routes give a better operational fit.
The district decision matrix compares exact buildings and routes. The trap to avoid is swapping one unexamined belief — "Central is always best" — for its mirror image — "decentralised is always cheaper".
3. Price the decision from proposals, not from an index
A conventional Grade A rental index cannot price a serviced-office room. Only the operator's proposal can.
For every viable option, capture the same fields:
| Decision field | Evidence to obtain |
|---|---|
| Product | Exact operator, centre, building and room or suite |
| Capacity | Billable desks, practical peak attendance and approved layout |
| Timing | Proposed start date, access date and proposal-valid-until date |
| Commitment | Initial term, renewal or indexation mechanism, notice and exit conditions |
| Monthly cost | Workspace charge plus every recurring item outside it |
| Initial cash | Deposit, advance payment, set-up and other one-off charges |
| Operating fit | Access, air-conditioning, IT, meeting rooms, printing, mail, visitor handling and usage limits |
| Flexibility | Expansion, contraction, substitution or transfer options, in writing |
Collect proposals inside a short common window. If one quote is a week older than the others, reconfirm the room, rate and terms before treating them as simultaneous: room status can change within a week.
Use the 14-field quote comparison for the commercial side and the 30-minute viewing scorecard for the physical evidence.
Our current serviced-office snapshot
The live block above reports current published Hong Kong serviced-office listings, buildings, operators and districts, with a separate Central subset and fresh-price sample. These are counts of published choice, not vacant rooms, and several listing rows can belong to a single centre.
The price subset keeps only positive numeric starting prices verified within the previous 30 days and reports the current operator-building groups and operators. We take a median inside each operator-building group first, so centres publishing more rooms do not quietly carry more weight — the method is set out in How Much Does a Serviced Office Cost in Hong Kong?.
What we are deliberately not doing is turning that sample into a trend. A defensible trend needs dated, immutable snapshots, and our database does not hold them yet. When it does, we will publish the series and say how far back it runs.
Signal to action
| Observed signal | Appropriate action | Evidence needed first | Wrong inference |
|---|---|---|---|
| Central conventional Grade A rents rose strongly in JLL and CBRE's 1H measures | Get a hard Central requirement and fixed start date into the search now | Current named-room availability and a proposal | "Every Central serviced-office price rose by the same percentage" |
| JLL found the movement concentrated in Central A1, not every tier | Keep building and room quality visible; treat Central as several products | Exact building, room, fit-out, services and terms | "Every Central building faces the same pressure" |
| Other conventional submarkets moved differently | Keep viable district alternatives and compare repeated journeys | Exact-building routes plus current serviced proposals | "A weaker conventional submarket means a cheaper serviced office" |
| We have current published choice in Central and elsewhere | Use the catalogue to build a shortlist | Operator confirmation for your date, term and room | "Published means vacant now" |
| A research house publishes a full-year forecast | Use it for scenario planning | A current proposal plus your acceptable budget range | "The forecast is a guaranteed future quote" |
Three worked situations
Hypothetical workflows, not client cases.
Fixed Central address, fixed move date. Start with named Central rooms that clear the date, capacity and operational gates. Hold one Central fallback and one nearby-district fallback. Confirm proposal validity and viewing dates before spending time on brochure-level comparison.
Flexible address, frequent Central meetings. Compare Central against exact buildings in Admiralty, Wan Chai or Sheung Wan. Measure the repeated door-to-door journeys and the visitor routes, then compare total room cost. The answer may well still be Central — but it should come from the operating trade-off, not a headline.
Renewal in an existing serviced office. The 7.3% and 10.7% conventional figures have no business in this decision. Get the operator's written renewal proposal and at least one like-for-like relocation option covering the same period, then compare total cost, disruption, room condition and where you go next when you grow.
Frequently asked questions
Are Central serviced-office prices rising in 2026?
We cannot claim that from the current evidence. JLL, CBRE and RVD all measure conventional private offices. We have a current serviced-office snapshot but no like-for-like historical series yet. Use a room-level proposal for today's price, and treat a live catalogue as a snapshot rather than a trend.
Does lower Central vacancy mean I should sign immediately?
No. JLL's 8.8% describes its Central Grade A market at the end of June, not the availability of the room you want. It is a reason to move promptly on a fixed Central brief — not a reason to skip comparison, viewing or reading the agreement.
Has tenant negotiating leverage disappeared?
No market percentage can answer that. What is negotiable depends on the room, the operator, the building, your start date and term, competing demand, and the proposal in front of you. Ask for the terms that matter to your brief and compare written alternatives.
Which district should replace Central?
There is no automatic substitute. Start from employee origins, repeated client destinations, visitor routes and any hard address or transport requirement, then test real rooms in the districts that actually solve those journeys.
Why do JLL, CBRE and RVD show different figures?
Different building baskets, geographies, periods and methods. RVD combines Sheung Wan and Central and dates evidence to tenancy commencement; JLL and CBRE each publish their own Central Grade A series. Keep every number attached to its definition.
Can your catalogue show whether supply is tightening?
Not yet. A live table shows current published records, and rows get added, updated and removed. A defensible trend needs dated, immutable snapshots and rules that hold the product definition steady over time. That is on the roadmap, not in this article.
Turn the signal into a shortlist
Tell us which districts are fixed and which are flexible, your team size and peak attendance, the target start date, likely term, required layout and total monthly budget. We will scan current serviced-office options, flag what still needs operator confirmation, arrange viewings and put comparable room-level proposals side by side.
Compare serviced offices in Hong Kong
Sources and methodology
- JLL — JLL raises 2026 Central Grade A office rent forecast to up to 15%, published 6 July 2026; accessed 9 August 2026.
- CBRE — Hong Kong Real Estate Market Continues Recovery Momentum in Q2 2026, published 7 July 2026; accessed 9 August 2026.
- Rating and Valuation Department — Hong Kong Property Review Monthly Supplement, August 2026, especially Tables 2.3 and 2.5; accessed 9 August 2026.
- Rating and Valuation Department — Technical Notes, especially the rent and index methodology; accessed 9 August 2026.
- My Office Asia published Hong Kong serviced-office catalogue, live read-only snapshot; the component displays its own data date.
External figures describe conventional private offices unless explicitly labelled as our serviced-office data. No source here is used to convert a conventional Grade A movement into a serviced-office price change.