Current MOA catalogue data
Current serviced-office starting-price benchmark
Data as of 14 August 2026
| Segment | Median | Middle 50% | Fresh listings |
|---|---|---|---|
| Central | HK$6,500 | HK$4,500–HK$8,000 | 21 |
| Tsim Sha Tsui | HK$5,300 | HK$5,000–HK$5,500 | 15 |
A flat median across all room rows is HK$5,500 (22% higher). Grouping by operator and building first prevents centres with more published rooms from carrying more weight.
Trailing 30-day verification window. Published starting prices are discovery data, not quotations or guaranteed room availability. The calculation excludes 7 rows without a positive price and 23 rows outside the freshness window.
Hong Kong serviced offices are usually advertised the same way: a starting price, per desk, per month. It is a useful number for working out whether a search is worth starting. It is not the price of a room you can actually move into.
The short answer
The current block above shows the location-normalised median, middle-50% range, qualifying sample and any district that clears the same coverage gate. It recalculates from the published catalogue rather than preserving a launch-day number in the article.
These are published starting prices, not signed deals. We count only numeric serviced-office prices verified in the previous 30 days, and leave out coworking products, "pricing on request" rows and anything older. The full method is at the end.
One number worth pausing on
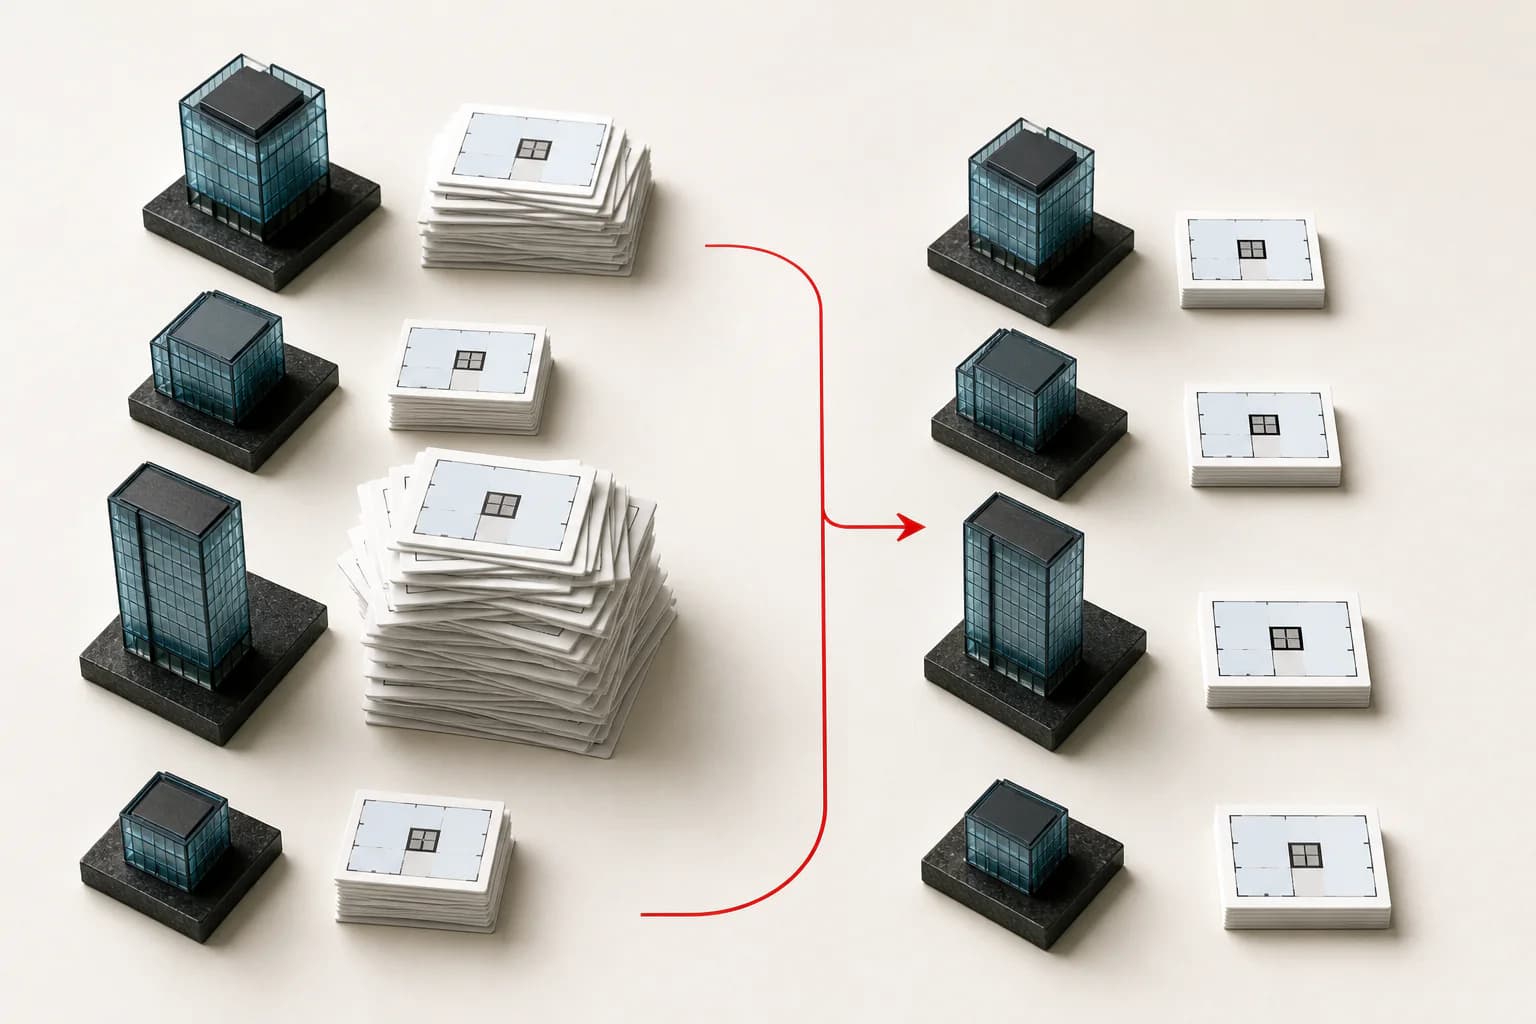
The live block also recalculates a flat listing median from the same qualifying set and shows the relative gap only when both figures are available.
The difference between that flat figure and the location-normalised benchmark comes entirely from weighting. A few centres publish many rooms; others publish one. Average the rows and those larger, more heavily documented centres quietly carry more weight. We take the median inside each operator-building group first, then take the median across those group medians, so every centre counts once.
It is a small methodological choice with a four-figure consequence. Worth remembering whenever you meet a market average with no method attached.
What "starting price per desk per month" actually means
It is an entry point for comparison, not an invoice.
Operators describe rooms by their maximum billable desks, and dividing by that number makes suites of different sizes scannable side by side. But serviced offices are sold as specific rooms. Multiply the benchmark by your headcount and you get a budget line, not a room that exists.
Three numbers to keep apart:
- Published starting price — the catalogue figure you compare with.
- Room quotation — the operator's proposal for a named room, at a stated capacity, start date and term.
- Complete monthly cost — that quotation plus everything recurring that sits outside it.
The room an operator can sell you today may not be the one behind the "from" price. Regus explains on its own pages that published prices depend on the product, the contract basis and what is actually free. That is one operator describing its own pricing, not a rule that binds the industry — but it is a fair illustration of why a starting price should never be read as live stock.
How to use the benchmark without under-budgeting
Use the citywide figure to sanity-check whether a serviced office fits your budget at all. Build the real budget from room-level proposals.
1. Work out practical capacity before you multiply anything
Start with peak attendance rather than payroll. Then add what the team actually needs: somewhere to take a confidential call, an internal meeting room, storage, a manager's office, or simply a less dense layout than the operator has drawn.
We record two capacity figures for every option — the operator's billable desks and the number of people the client can comfortably house. Those numbers can differ. A room sold as twelve desks can be too tight for a team that needs a meeting room inside the suite, and too big for a hybrid team that never has twelve people in at once.
2. Compare rooms, not centres
Ask for the room or suite reference, the operator's stated capacity, whether it faces a window or sits internal, and the condition it will be handed over in. One building can hold several products at very different prices.
Regus confirms the mechanics: its pricing moves with size, location and position within the centre, window rooms included. Our own operator materials track capacity and window status against room-level prices for the same reason. Neither gives you a formula. Both make the point that two rooms at one address are not the same product.
3. Put every proposal on the same monthly basis
When one operator quotes a whole-room monthly fee and another quotes per person, convert both:
quoted monthly room cost ÷ operator-stated billable capacity
Then keep the whole-room total next to it. The per-desk figure is for comparing. The total is what your budget has to carry.
4. Add the separately charged items before you pick the cheapest headline
GovHK notes that general office facilities usually come with a serviced office, and that some centres also provide meeting rooms or secretarial support. It stops short of defining a standard package. Operators show the same need for proposal-level checking from the product side: Regus lists standard inclusions alongside paid extras, and Eaton Club ties access conditions to the membership plan.
So the safe assumption is not "it's all included". It is "find out where this proposal stops".
Why two quotes for the same thing differ so much
District and building
Where the live block has enough fresh evidence to publish a Central distribution, compare it with the citywide range rather than assuming a fixed premium. The two can overlap. A Central address does not make every room dearer than every room outside it, and price on its own does not establish building quality, transport convenience or whether the place suits the clients who will visit you.
For other districts we are holding prices back until each sample reaches ten fresh listings, three operator-location groups and two operators. A median built from one centre would look precise and mean very little.
Room size and billable capacity
Small rooms, large suites and custom layouts are different products, priced differently. The question is not "we have eight people". It is "we need eight workable positions, a room we can close for calls, and space to reach eleven without moving again".
Window, outlook and position in the centre
Window and internal rooms carry different prices. Floor level, outlook, light, noise and privacy all change how two otherwise similar rooms compare. Check these on the specific room — photographs of the lounge or a different suite prove nothing about yours.
Term, start date and availability
An advertised starting price may be tied to a particular contract length. The commencement date, commitment and inventory available when the operator quotes can all change the number. Ask for the term and start date to be written next to the price.
Fit-out, IT and services
A furnished room on shared internet is not comparable with one that includes a reconfigured layout, a dedicated line, branding or extra support. Some of this is bundled, some is capped by credits, some is billed on use.
What a complete comparison covers
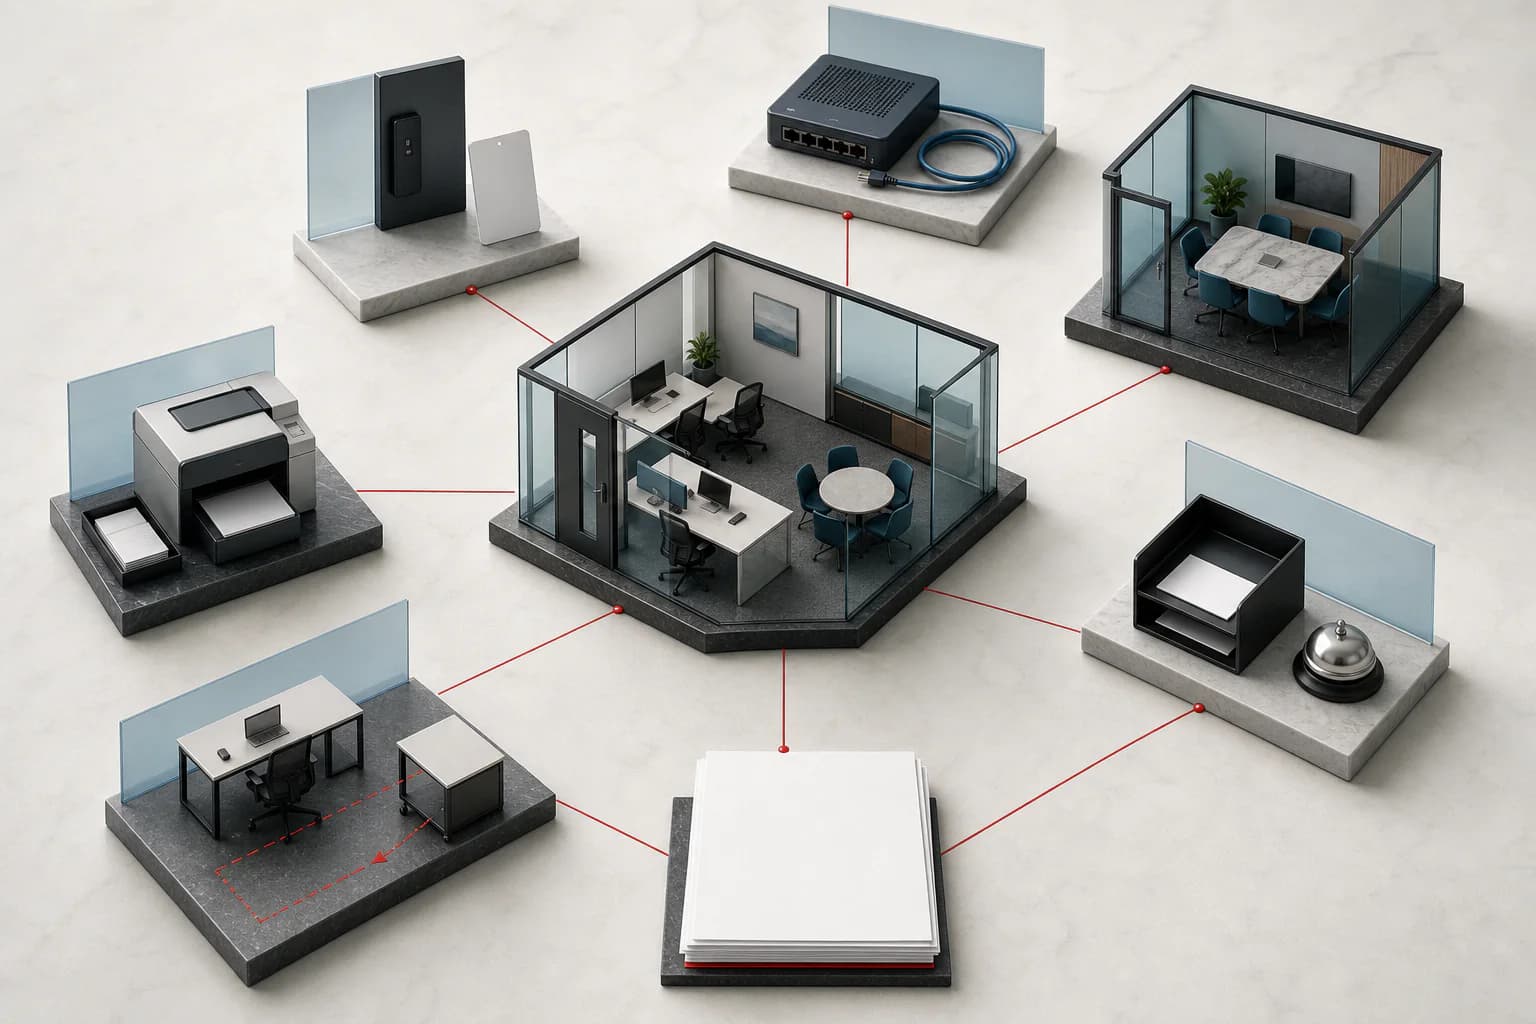
Before concluding that one room is cheaper, line these up:
| Field to confirm | Why it changes the comparison |
|---|---|
| Exact room or suite | Confirms the proposal matches the space you viewed |
| Billable capacity and practical capacity | Stops a low per-desk figure hiding an oversized or overcrowded room |
| Monthly price basis | Separates per-room, per-desk and limited-access products |
| Deposit and payment schedule | Shows the cash needed before you move in |
| Set-up or activation charges | Catches one-off onboarding costs |
| Internet and IT | Distinguishes shared access from a dedicated or configured service |
| Meeting rooms | Shows included credits, booking rules and overage rates |
| Printing, telephone and mail | Identifies what is capped or billed separately |
| Reception and visitor handling | Confirms what a client walking in will actually experience |
| Access hours and after-hours air-conditioning | Tests whether the space supports how your team really works |
| Furniture, layout changes and branding | Makes clear what is delivered at the quoted price |
| Renewal, notice and price review | Shows how the commitment changes after the first period |
| Exit, damage and restoration | Surfaces the obligations that arrive at the end, not in the headline |
Not every operator charges for every line. The table exists to make the omissions visible.
Three ways budgets go wrong
Treating the median as a quote. The current median describes the middle of the qualifying operator-building starting points shown above. It reserves nothing, proves nothing about availability, and caps no one's proposal.
Multiplying the benchmark by headcount. Ten people do not automatically need ten billable desks, and a ten-desk suite may be the wrong shape entirely. Establish peak attendance and practical capacity first, then price real rooms.
Comparing "all-inclusive" without listing what's in it. The phrase only means something once both sides define it. Meeting rooms, printing, IT, access, mail, coffee, set-up and exit terms can sit inside a package, outside it, or half in. Compare the schedule, not the adjective.
How we calculated the benchmark
For each refresh, the live block queries our published Hong Kong catalogue and keeps only rows that are:
- classified as serviced offices;
- carrying a positive numeric
monthly_price_from; - carrying a
price_verified_atdate within the previous 30 days.
The block reports the current included sample, operator-building groups, operators and exclusions alongside the result.
Because some centres publish several rooms and others publish one, we take the median within each operator-building group first, then calculate the headline median and middle-50% range across those group medians. The separate flat-row median uses the same qualifying listings and exists to make the effect of weighting visible.
The limits are worth stating plainly. Our catalogue is not a census of every Hong Kong operator. These are asking prices, not signed terms. And our database does not yet hold the immutable history a price trend would require, so we are not claiming one. Read the benchmark as a dated view of current published inventory, and nothing more.
Frequently asked questions
Is the displayed median the average serviced-office price in Hong Kong?
No. It is the location-normalised median of our qualifying published listings on the displayed date — not a population average for every serviced office in the city.
Are utilities, internet and meeting rooms included?
It depends on the operator and the proposal. General office facilities usually come with a serviced office, but named services may be included, capped or charged on use. Get the full schedule for the exact room.
Does a Central serviced office always cost more?
No. Even when Central's current eligible median is higher, the distributions can overlap. Room size, position, operator, building, term and inclusions can all outweigh the district label in any individual comparison.
How often should a price benchmark be updated?
The data block should recalculate from the live catalogue and drop any price verified more than 30 days ago. The article's modification date should change only when the analysis or the guidance changes — the data date is shown separately, and the two should never be merged.
What budget should I give an office adviser?
The total monthly figure you are willing to carry, along with team size, peak attendance, preferred districts, move date, expected term and anything about the room that is non-negotiable. A per-desk ceiling helps if you have one, but it should never stand in for the whole-room and complete-cost view.
Compare current serviced-office options
Use the benchmark to set a first budget, then compare real rooms on the same basis. Send us your preferred districts, team size, peak attendance, target move date, expected term and total monthly budget, and we will organise the relevant options — with the room, capacity, price basis, inclusions and outstanding operator confirmations set out side by side.
Compare serviced offices in Hong Kong
Sources and methodology
- My Office Asia published Hong Kong catalogue, live read-only data; the block displays its own data date. Benchmark methodology reviewed 9 August 2026. See the methodology section above.
- GovHK — Renting an Office or Business Premises, last review shown as May 2025; accessed 9 August 2026.
- Regus — Office Space for Rent / Serviced Offices, accessed 9 August 2026.
- Regus — Office Space in Tsim Sha Tsui, accessed 9 August 2026.
- Compass Offices — Centre Directory, accessed 9 August 2026.
- Eaton Club — Private Office, accessed 9 August 2026.